Search a school
��
1 College

Saint Louis, MO
•
Public57%Acceptance rate
3.47Avg GPA
$41KCost
13KUndergrads
Type to search
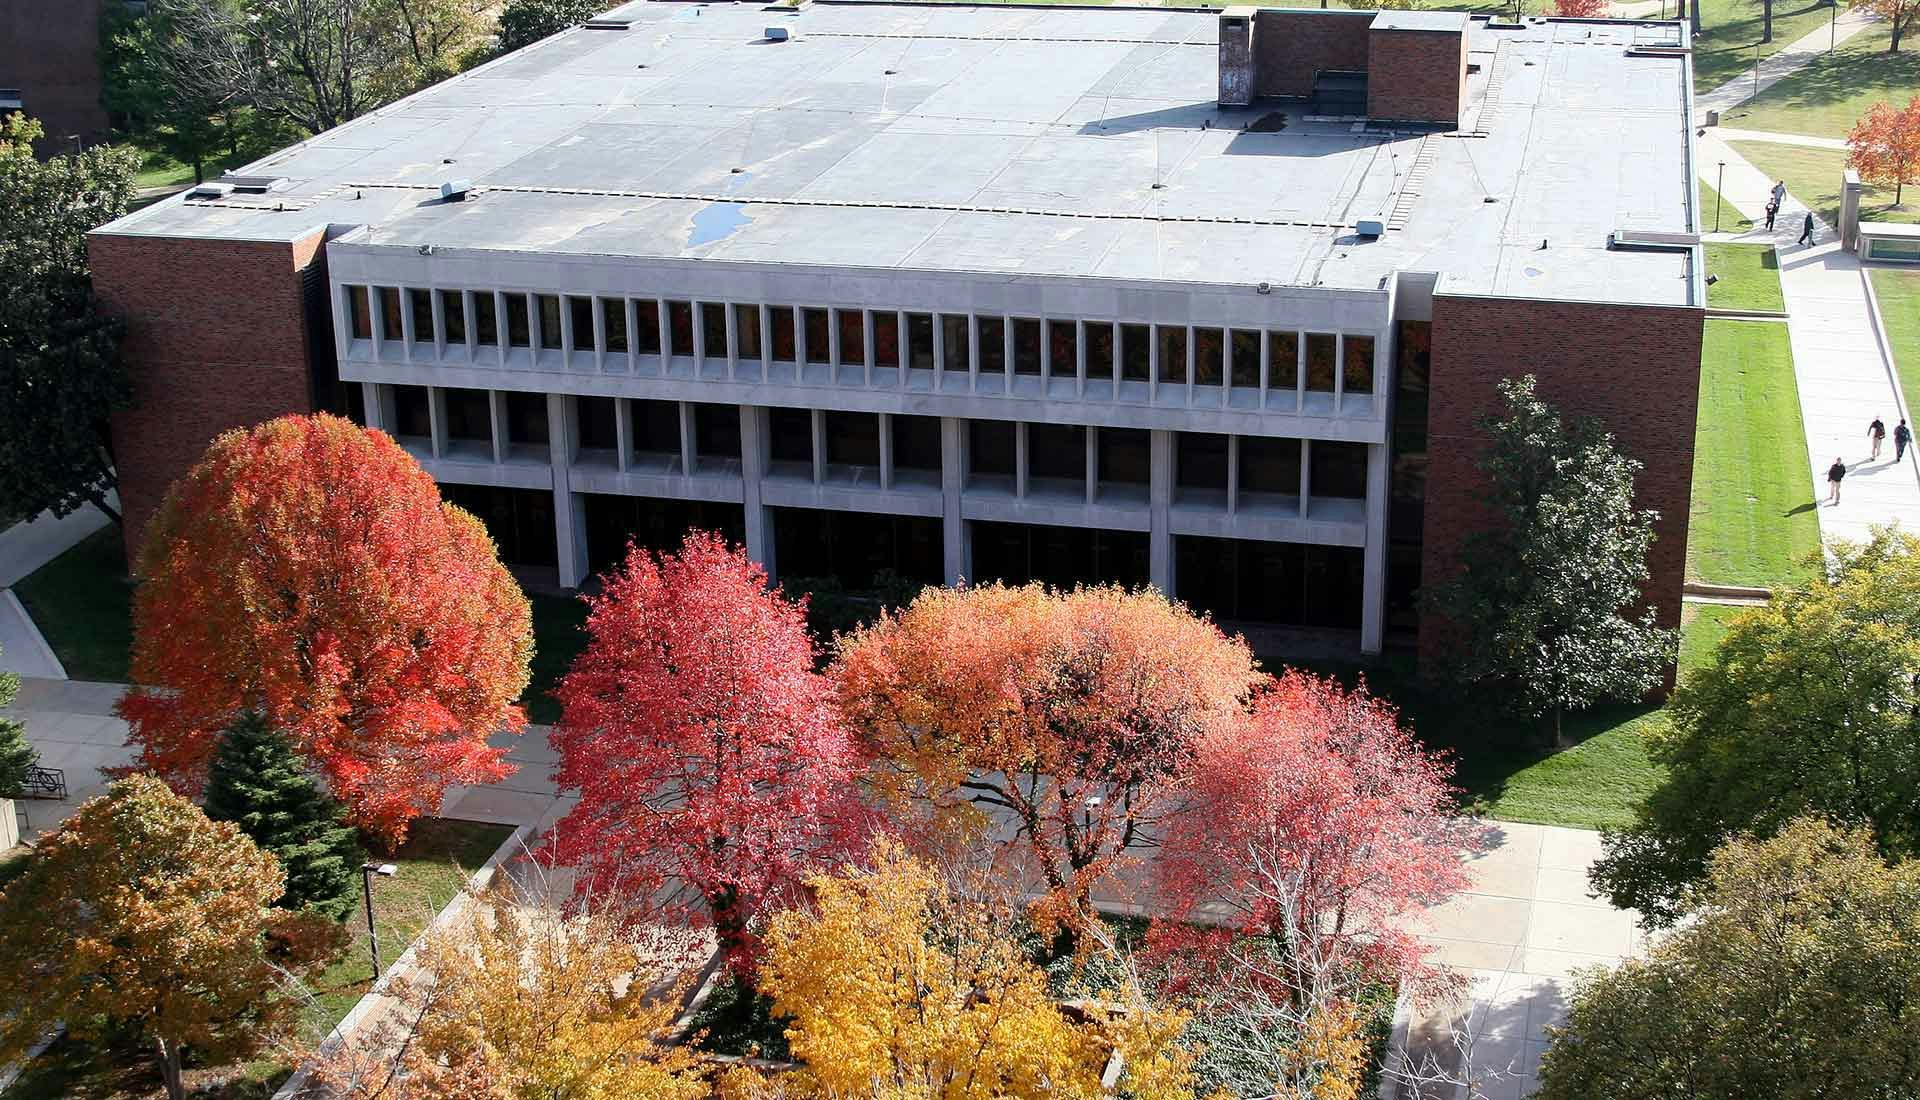
University of Missouri–St. Louis | UMSL
Saint Louis, Missouri•2-year•Public
Your chances
—
Acceptance rate
57%
Public school in Missouri with 12,700 total undergraduate ����ֱ��
Suburban
Plains
Commuter college
On campus housing
Great Lakes Valley Conference
One University Boulevard, Saint Louis, MO 63121
(314) 516-5000
���Dz��徱�Բ�…
Admissions
Overall acceptance rate
57%
Yield rate - overall
29%
Acceptance rate breakdown
Women
55%
Men
58%
Applicant breakdown
Total number of applicants
3,054
Women: 61%
Men: 39%
Cost & scholarships
Your estimated net cost
$ ? / year
In-state
$22,613
Out-of-state
$40,880
Average net cost after aid
Income
Average net cost
$0–30,000
$7,311
$30,001–48,000
$9,685
$48,001–75,000
$11,523
$75,001–110,000
$19,066
Over $110,000
$18,192
Published costs and averages can be misleading: they don’t fully account for your family’s finances (for financial aid) or your academic profile (for scholarships).
Want to see your personalized net cost after financial aid and scholarships?
Applications
How to apply
Accepts Common App
Test optional
Rec letters not used
Considers class rank
TOEFL required (international applicants)
Tests typically submitted
SAT: 8%
ACT: 36%
Policies can change. Please confirm by looking at
����ֱ��
First-year enrolled ����ֱ�� (full-time)
446
Student diversity
Low diversity
4-year graduation rate
34%
6-year graduation rate
52%
Retention rate
76%
Admission policy
Co-ed
International ����ֱ��
2%
Enrolled breakdown by gender
Women: 54%
Men: 46%
Race & ethnicity diversity
Among domestic ����ֱ��Asian and Pacific Islander
5%
Black
14%
Hispanic
3%
Native American
< 1%
Other
6%
White
71%
Academics
Student faculty ratio
19:1
Calendar system
Semester
Special academic offering
Study abroad
Credit for AP exams
Offers graduate degree
Where does this data come from?